
Analytics Dashboards
Build analytic interfaces with endless flexibility and no limitations
Performance Analytics
Total Revenue
$24,568
+12.5% from last week
Active Users
1,245
+7.2% from last week
Conversion Rate
3.8%
+0.6% from last week
Avg. Session
4m 32s
-1.2% from last week
Revenue Trend
Traffic Sources
User Activity
Top Performing Pages
/products
/pricing
/features
/blog
Overview
Analytics dashboards turn your raw data into meaningful insights that drive better decision-making. Hardcoded enables you to create custom analytics dashboards with interactive visualizations that make it easy to understand trends, patterns, and outliers in your data.
Key Features
Interactive Visualizations
Create dynamic charts and graphs that respond to user interactions.
Data Filtering
Allow users to slice and dice data with advanced filtering options.
Export Capabilities
Export reports and visualizations in various formats.
Scheduled Reports
Set up automated report generation and distribution.
Explore Other Use Cases
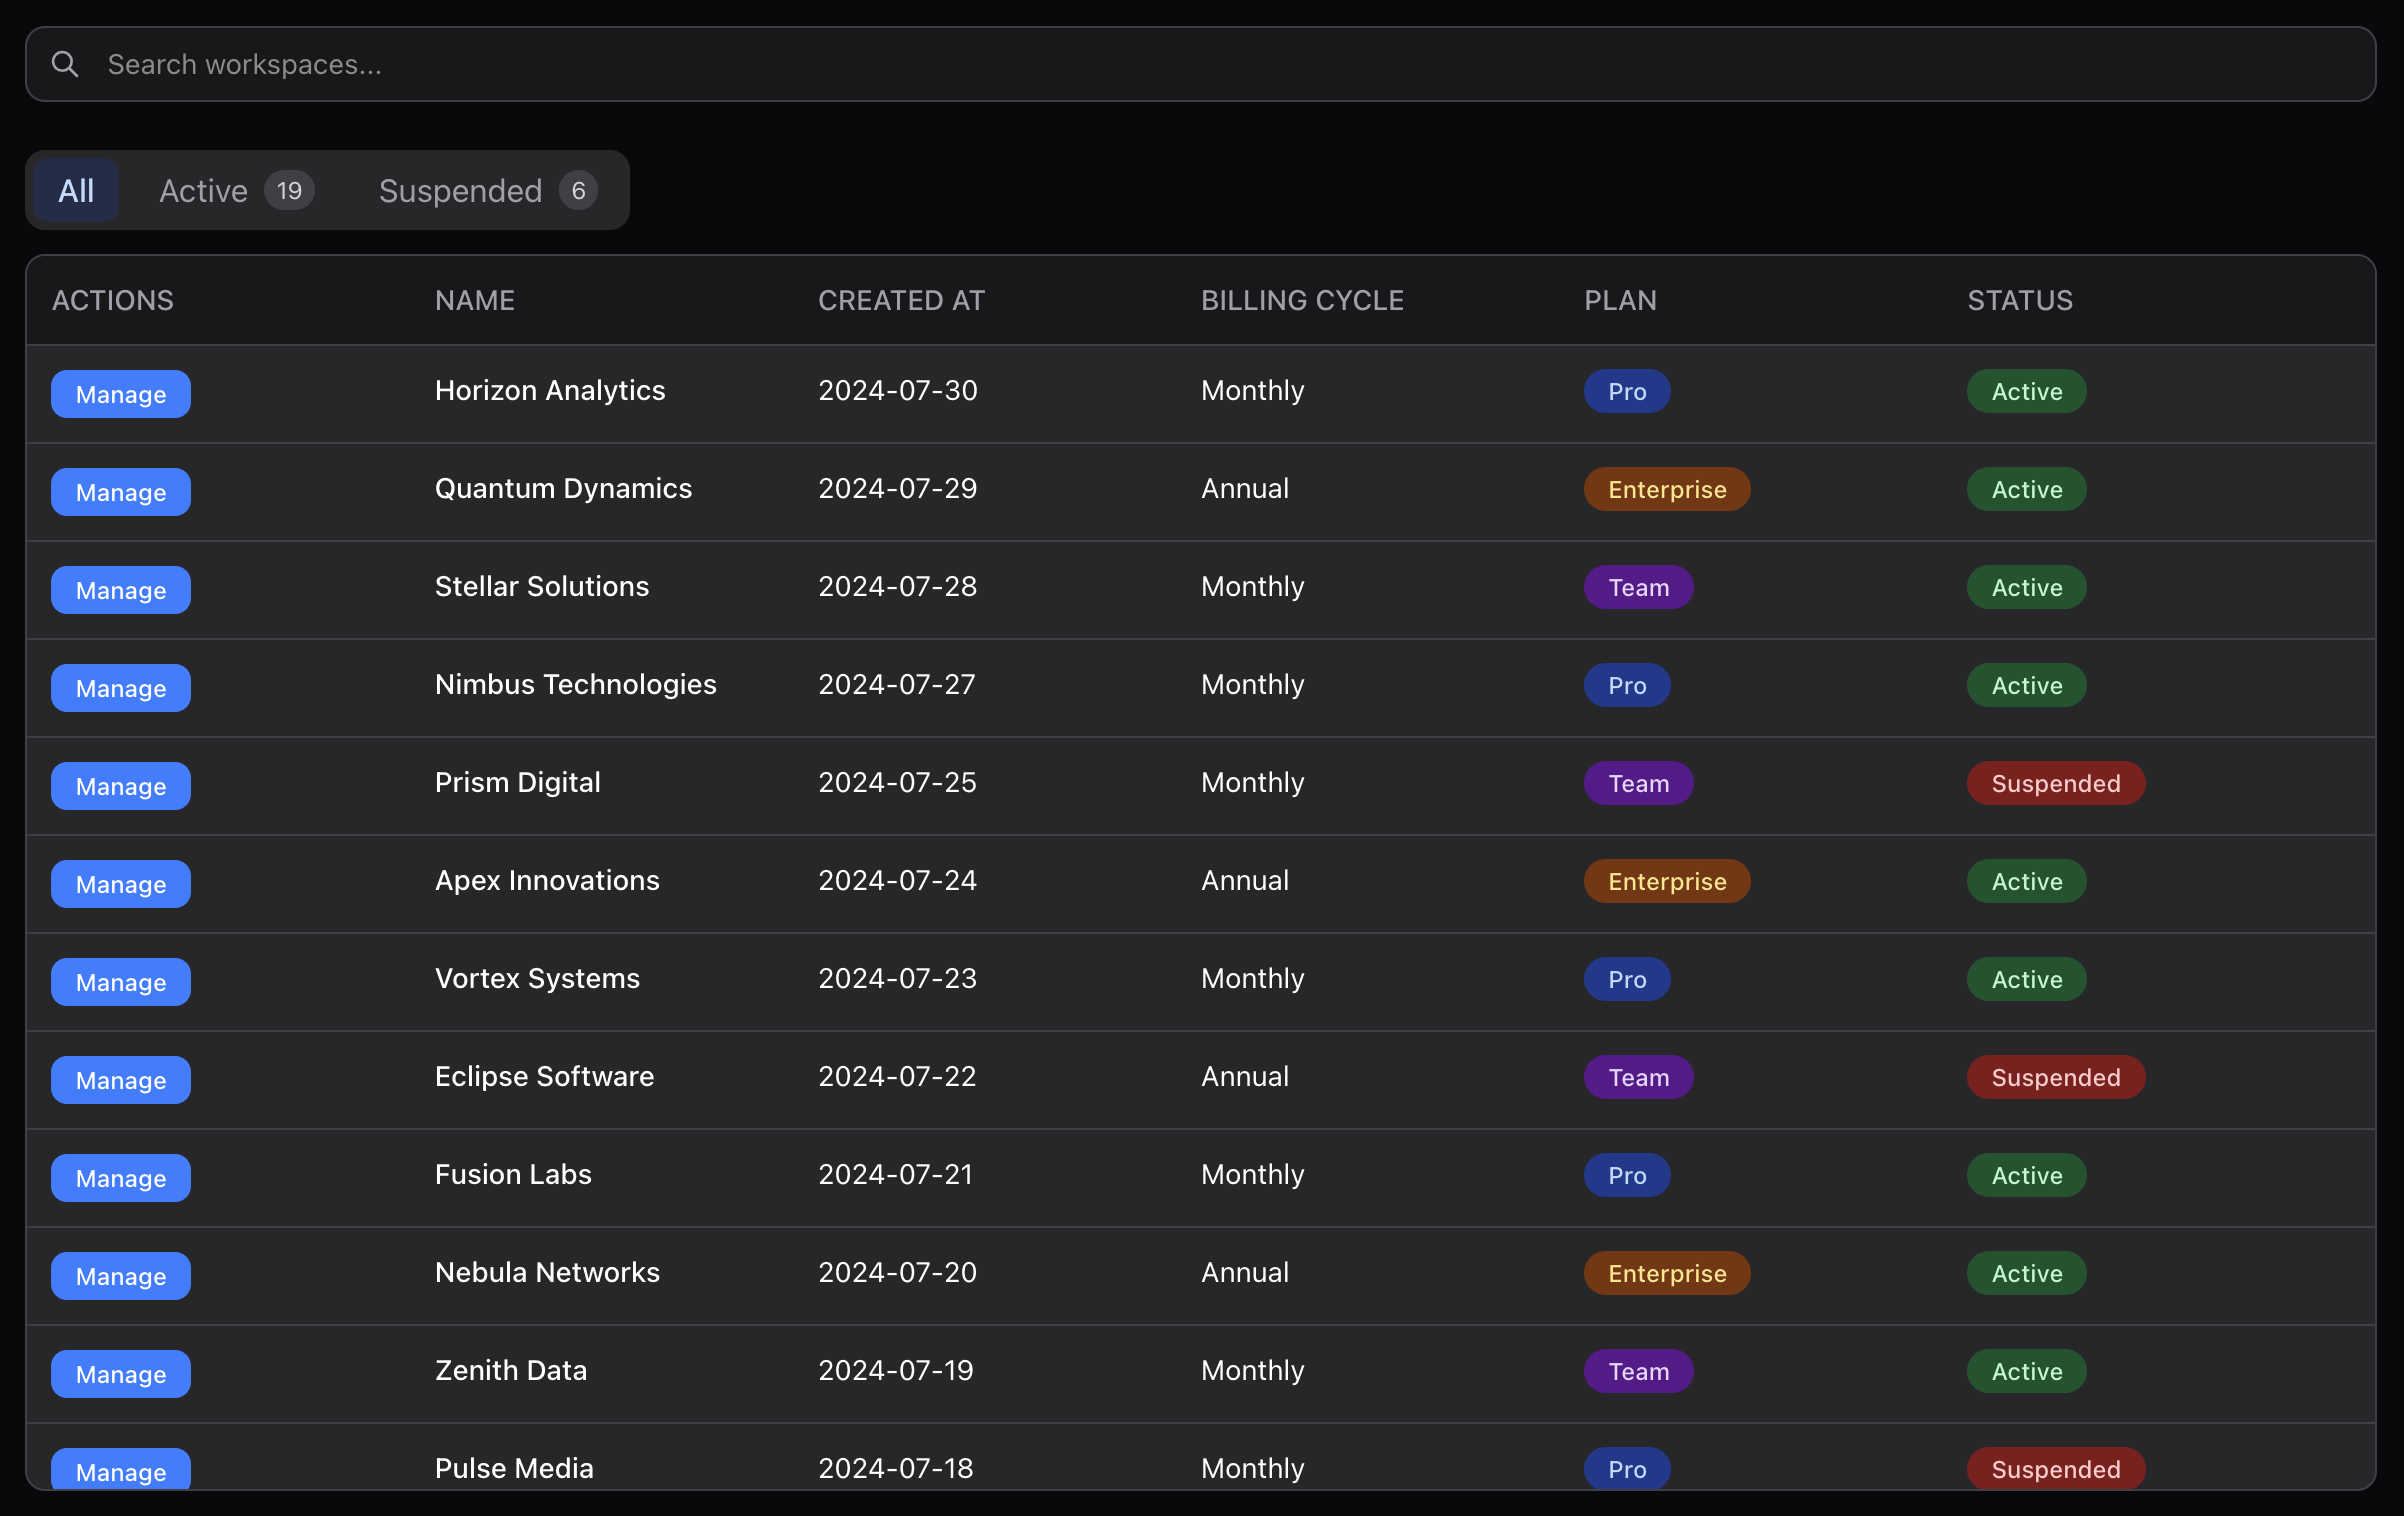
Admin Dashboards
Customize views, manage permissions, and access all your critical operations from one place.
Learn more →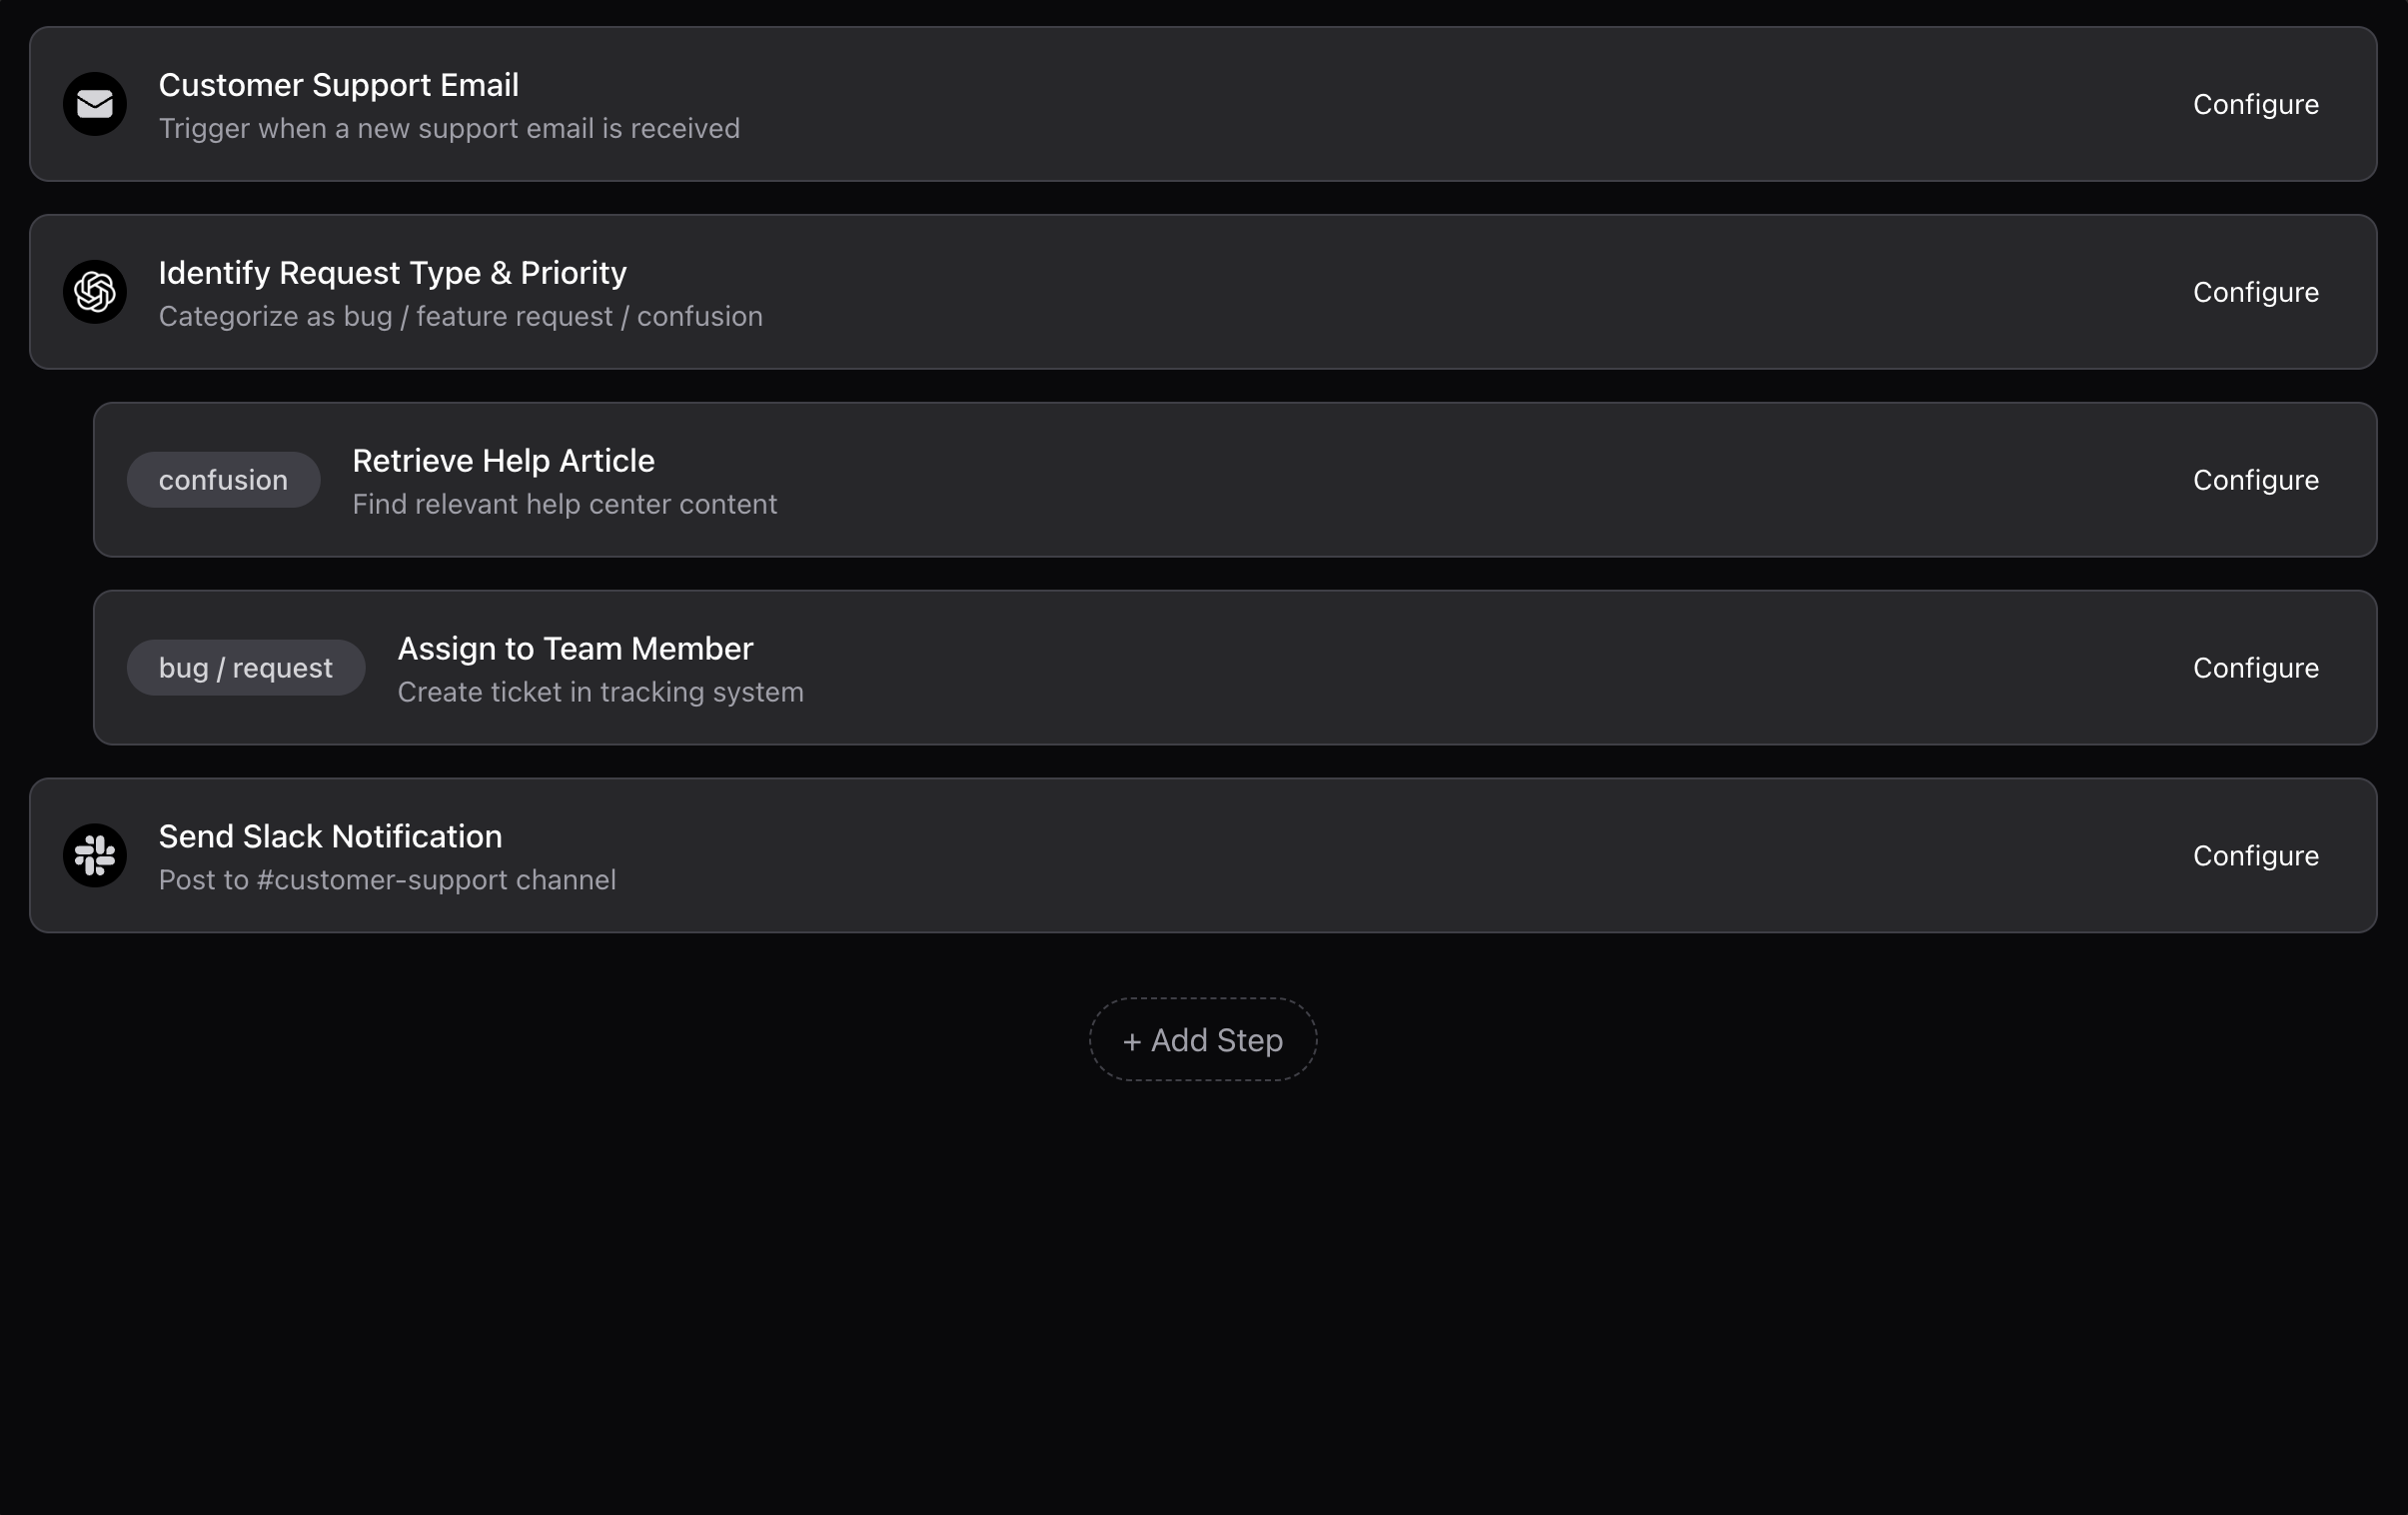
Workflow Automation
Streamline operations with custom workflows tailored to your team's needs. Automate repetitive tasks, connect disparate systems, and ensure consistent processes across your organization.
Learn more →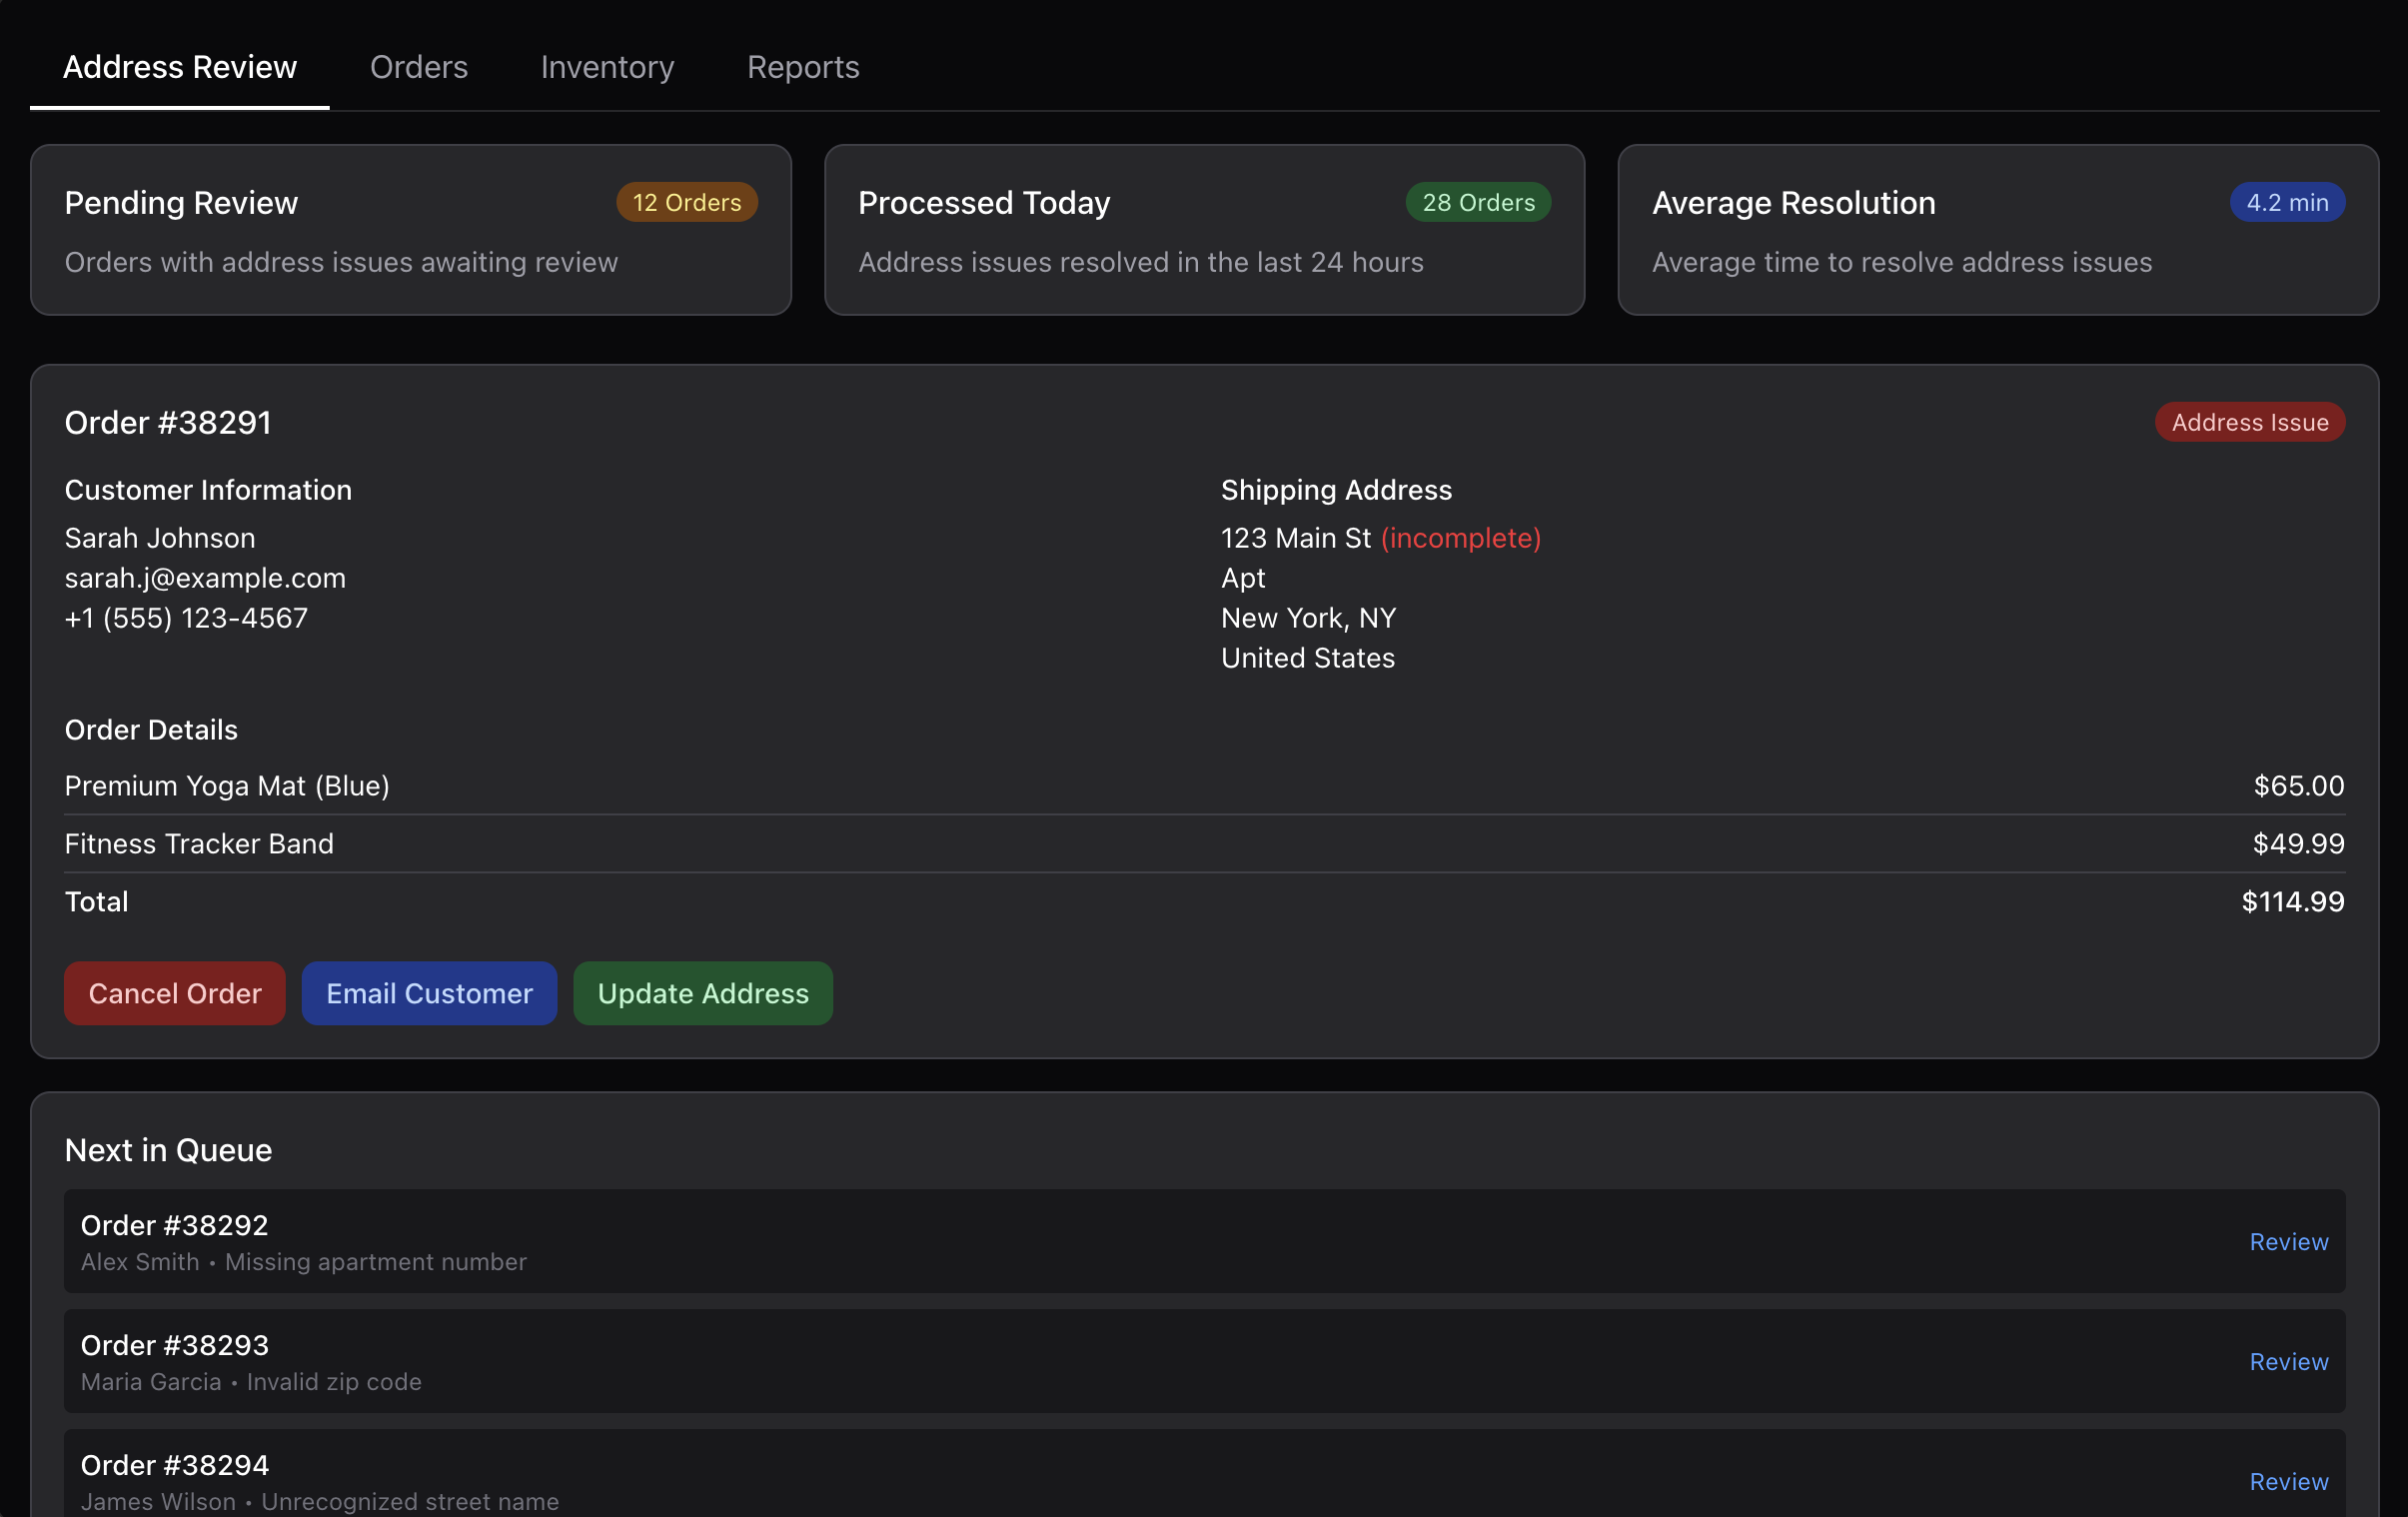
Operations Flows
Monitor and manage your business operations with real-time insights. Track key metrics, identify bottlenecks, and make data-driven decisions to optimize your business processes.
Learn more →